Abstract
Yarn breakage in ring-spinning remains one of the most significant contributors to production downtime and quality loss in modern textile mills. This paper presents a first-principles predictive model that quantifies the end-break rate (EBR) expressed as breaks per 100 spindles per hour using a Poisson stochastic framework. The model integrates four independently computed tension components — spinning tension (Sₜ), ballooning tension (Bₜ), winding tension (Wₜ), and aerodynamic drag tension (Aₜ) — with fibre characterisation via the Spinning Consistency Index (SCI) to derive the mean link-frequency at the front-roller nip. The probability of breakage is modelled as an exponential decay function of the stress-strength ratio (mean yarn strength / total tension), scaled by the total number of fibre-bundle links traversing the nip per unit time across 1,008 spindles. Applying the model to a 30s Ne carded yarn with a SCI of 131.50 yields a predicted EBR of 5.91 breaks per 100 spl/hr. Sensitivity analysis reveals that spindle speed, top-arm load, and mean yarn strength are the most influential parameters. The model provides process engineers with a tractable, real-time diagnostic tool for root-cause analysis and parameter optimisation, thereby reducing waste, improving yield, and advancing the state of predictive quality control in ring-spinning. Limitations including the assumption of constant environmental conditions and the empirical derivation of the proportionality constant are discussed in detail.
Keywords
Yarn Breakage, End-break Rate, Spinning Consistency Index (SCI), Poisson Process, Stress-Strength Model, Ring Spinning, Predictive Modelling, Spindle Speed
1. Introduction
Yarn breakage is a critical quality and productivity issue in the ring-spinning sector of the global textile industry. Every yarn break event interrupts the spinning of an individual spindle, demands manual piecing, introduces a splice that can adversely affect downstream winding, weaving, or knitting operations, and contributes to measurable fibre and time losses. In a typical 1,008-spindle machine operating at 16,000-18,000 rpm, even a modest improvement of one break per 100 spindles per hour can translate to several thousand rupees per shift in labour, fibre, and downtime savings.
Despite its economic significance, the mechanics of yarn breakage have historically been addressed through empirical rules of thumb, experience-based heuristics, and trial-and-error process adjustment, more recently, through data-driven prediction models based on machine learning techniques
. A rigorous first-principles model that ties observable input parameters — fibre properties, machine settings, and environmental conditions — to a quantitative end-break rate (EBR) prediction has been conspicuously absent in accessible practitioner literature
.
This paper addresses that gap by developing a comprehensive predictive model based on two well-established theoretical frameworks:
1) Tension mechanics: derivation of spinning tension, ballooning tension, winding tension, and aerodynamic drag tension from machine geometry and yarn properties.
| [3] | Mukherjee, A., & Yadav, P. K. (2012). Study of balloon collapse during ring spinning. Indian Journal of Fibre & Textile Research, 37, 42-48. |
| [7] | Wu, X., Hurren, C., Li, W., & Wang, X. (2023). Modeling the temperatures of traveler and ring in ring spinning. Textile Research Journal, 93(13-14), 3170-3183.
https://doi.org/10.1177/00405175231170312 |
| [8] | Wu, X., Hurren, C., Li, W., & Wang, X. (2022). Numerical analysis of heat transfer in ring spinning. Textile Research Journal, 92(22), 3990-4007.
https://doi.org/10.1177/00405175221098576 |
| [9] | Ling, Y., Chen, M., Liu, Y., et al. (2023). A modified hand-held force meter to measure yarn tension in the ring spinning process. Fibers and Polymers, 24, 2967-2975.
https://doi.org/10.1007/s12221-023-00271-z |
| [13] | Cui, P., Zhang, Y., & Xue, Y. (2020). Detection and Analysis of Real-Time Dynamics of Yarn Tensions in a Ring Spinning Frame. Journal of Fiber Science and Technology, 76(6), 190–198. |
| [14] | Yin, R. (2021). Mathematical modeling and numerical simulation of nonlinearly elastic yarn in ring spinning. Textile Research Journal, 91(3–4), 278–288.
https://doi.org/10.1177/0040517520940807 |
[3, 7-9, 13, 14]
2) Poisson stochastic process: treatment of each fibre-bundle link traversing the front-roller nip as an independent opportunity for a breakage event, with the probability of each event modulated by the stress-strength ratio.
| [1] | Saville, B. P. (1999). Physical Testing of Textiles. Woodhead Publishing, Cambridge. |
| [9] | Ling, Y., Chen, M., Liu, Y., et al. (2023). A modified hand-held force meter to measure yarn tension in the ring spinning process. Fibers and Polymers, 24, 2967-2975.
https://doi.org/10.1007/s12221-023-00271-z |
| [11] | Ross, S. M. (2019). Introduction to Probability Models (12th Edition). Academic Press. ISBN: 9780128143469 |
| [12] | Montgomery, D. C., & Runger, G. C. (2018). Applied Statistics and Probability for Engineers (7th Edition). Wiley. ISBN: 9781119450375 |
| [14] | Yin, R. (2021). Mathematical modeling and numerical simulation of nonlinearly elastic yarn in ring spinning. Textile Research Journal, 91(3–4), 278–288.
https://doi.org/10.1177/0040517520940807 |
| [15] | Tang, H. B., Xu, B. G., Tao, X. M., & Feng, J. (2011). Mathematical modeling and numerical simulation of yarn behavior in a modified ring spinning system. Applied Mathematical Modelling, 35(1), 139–151.
https://doi.org/10.1016/j.apm.2010.05.013 |
[1, 9, 11, 12, 14, 15]
The Spinning Consistency Index (SCI), a composite fibre-quality metric derived from HVI (High Volume Instrument) measurements, serves as the bridge between fibre characterisation and the mechanical model. By unifying these elements into a single predictive equation, the model enables process engineers to:
1) Evaluate the theoretical EBR for a given fibre lot before it enters the spinning frame.
2) Identify which tension component contributes most to a high EBR and adjust the corresponding machine parameter.
3) Conduct sensitivity analysis to prioritise quality improvement efforts.
4) Build data-driven process windows for sustainable, low-breakage spinning
| [2] | Ergene, D., & Üreyen, M. E. (2018). Prediction of end breakage rates in ring spinning by artificial neural networks. Fibers and Polymers, 19(3), 658-666.
https://doi.org/10.1007/s12221-018-7810-9 |
| [4] | Lord, P. R. (2003). Handbook of Yarn Production: Technology, Science and Economics. Woodhead Publishing, Cambridge. |
[2, 4]
.
2. Spinning Consistency Index (SCI)
2.1. Definition and Significance
The Spinning Consistency Index (SCI) is a composite scalar index that aggregates the most influential HVI fibre properties into a single metric. It was originally developed to facilitate comparative ranking of cotton lots and to predict their relative spinning performance. A higher SCI indicates a fibre that is longer, stronger, finer, and more uniform — all attributes that reduce weak spots in the drafted fibre bundle and lower the probability of yarn breakage.
2.2. SCI Regression Equation
(1)
where Fs is fibre strength (gms/tex), F_mic is micronaire (μg/inch), UHML is Upper Half Mean Length (inches), Uni is the uniformity index (%), Rd is reflectance, and b2 is the yellowness index.
2.3. Fibre Property Influence on Link Formation
The concept of a "link" — a cohesive fibre bundle of finite length emerging continuously from the front-roller nip — underpins the stochastic model. The quality and frequency of these links are directly governed by fibre properties:
1) Fibre length (UHML): Longer fibres produce longer links with greater inter-fibre overlap, reducing the frequency of weak spots per unit time.
2) Fibre strength (Fs): Stronger fibres resist tensile failure within the link, reducing the probability that a given stress event exceeds the local link strength.
3) Micronaire (F_mic): Finer fibres (lower micronaire) pack more densely in the yarn cross-section, improving cohesion and creating a more uniform tension distribution.
4) Uniformity index (Uni): Higher uniformity reduces intra-yarn variance in linear density and cross-section, eliminating systematic weak zones that would otherwise concentrate applied tension.
3. Theoretical Framework and Model Architecture
3.1. Link Formation and Frequency
It is assumed that the spun yarn can be conceptualized as a series of discrete fibre-bundle links of mean length Al (metres). The mean link length is linearly related to the SCI:
A higher SCI produces longer links, meaning fewer link boundaries traverse the nip per unit time — and therefore fewer opportunities for a weak-spot breakage event. The frequency at which links emerge from the nip of a single spindle is:
The total number of links crossing the front-nip per second across all N spindles of the machine is:
(4)
This quantity represents the total "stress-application opportunities" per second. Even when individual breakage probability per link is very small, a large T_links drives a measurable EBR — consistent with the rare-event approximation of the Poisson process.
3.2. Poisson Process Model for Yarn Breakage
Under the Poisson framework, yarn breakage events are modelled as rare, independent occurrences in a continuous-time process. The rate (λ) of such events is proportional to:
1) The total number of stress-application opportunities per second (T_links).
2) The probability that any single link event results in a break, expressed as an exponential function of the negative stress-strength ratio.
The predicted breakage rate per second for 1,008 spindles is therefore:
(5)
where k = 2.45 × 10⁻5 is a dimensionless proportionality constant determined experimentally, cN_mean is the mean yarn breaking strength (cN), and TT is the total tension acting on the yarn (cN). The exponential term models the stress-strength interference probability: as cN_mean/TT increases, breakage probability decays exponentially.
The predicted EBR, expressed in the standard industry unit of breaks per 100 spindles per hour, is:
(6)
4. Yarn Physical Properties Derivation
4.1. Yarn Diameter
(7)
The constant 0.95 is empirically calibrated for standard carded and combed ring-spun yarns and accounts for the packing fraction of fibers within the yarn cross-section.
4.2. Cross-Sectional Area
Where CSA = yarn cross-sectional area (m2);= yarn diameter (m);= mathematical constant (≈ 3.14159). The yarn cross-section is assumed to be circular.
4.3. Lateral Surface Area in the Balloon Zone
(9)
where Bl is the maximum balloon length (m). LSA is the effective aerodynamic surface area of the yarn in the balloon region.
4.4. Linear Density
(10)
where:
1) = linear density of the yarn
2) = English cotton yarn count (Ne)
4.5. Yarn Velocity at the Ring
(11)
where R_dia is the ring diameter (m) and SS is the spindle speed (rev/s).
5. Tension Analysis
5.1. Spinning (Drafting Zone) Tension
(12)
This term captures the tension generated as the fibre bundle is accelerated from the back roller speed to the front roller speed. It is directly proportional to the nip load (R_load) and inversely proportional to the yarn cross-section, reflecting the stress-per-unit-area concept.
5.2. Ballooning Tension
(13)
Ballooning tension arises from the centrifugal force on the rotating yarn balloon between the ring and the front rollers. It scales with the square of yarn velocity and is therefore highly sensitive to spindle speed. Lower counts (higher linear density) exhibit proportionally higher ballooning tension at identical machine settings.
5.3. Winding Tension
(14)
For model simplicity, winding tension is estimated as 1.5× the ballooning tension, reflecting the additional tension required to wind the yarn onto the bobbin against the centrifugal force.
5.4. Air-Drag Tension
(15)
Air drag opposes the tangential motion of the yarn balloon. The drag force is proportional to the projected lateral surface area of the balloon (LSA/2) and to the square of yarn velocity. Standard values of A_drag = 0.82 and A_den = 1.22 kg/m3 are used; these should be adjusted in high-humidity or altitude-corrected mill environments.
5.5. Total Tension
(16)
where:
1) = total yarn tension
2) = mean spinning tension
3) = mean balloon tension
4) = mean winding tension
5) = mean aerodynamic drag-induced tension
6. Worked Example — 30s Ne Carded Ring-Spun Yarn
6.1. Input Parameters
All input parameters used for the base-case calculation are tabulated in
Table 1.
Table 1. Base-Case Input Parameters.
Sr | Parameter | Symbol | Value | Unit |
1 | Fibre strength | Fs | 30.4 | gms per tex |
2 | Fibre micronaire | F_mic | 4.4 | μg/inch |
3 | Fibre length (UHML) | UHML | 1.1575 | inches |
4 | Uniformity index | Uni | 82.1 | % |
5 | Rd (reflectance) | Rd | 76.2 | — |
6 | Yellowness (b2) | b2 | 9.5 | — |
7 | Surface speed - front roller | Vs | 0.330 | m/s |
8 | Mean yarn strength | cN_mean | 375 | cN |
9 | Yarn count | Ne | 30 | Ne (carded) |
10 | Max balloon length | Bl | 0.15 | m |
11 | Spindle speed | SS | 275 | rev/s |
12 | Ring diameter | R_dia | 0.036 | m |
13 | Top arm load | R_load | 90 | N |
14 | Drag coefficient | A_drag | 0.82 | — |
15 | Air density | A_den | 1.22 | kg/m3 |
16 | Spinning tension constant | k1 | 2.55 × 10⁻8 | — |
17 | Proportionality constant | k | 2.45 × 10⁻5 | — |
18 | Total spindles | Spdls | 1008 | nos. |
The calculation sequence presents a complete physics-based workflow for predicting the end-break rate (EBR) of a ring spinning frame by linking fiber quality, yarn geometry, spinning mechanics, and machine operating conditions into a single analytical framework. Rather than relying on empirical EBR alone, the method progressively builds the prediction from measurable process variables.
The below sequence of workflow establishes a logical chain of calculations:
Fibre properties → Spinning Consistency Index → Fibre link length → Link formation frequency → Yarn geometry → Yarn velocity → Mechanical tension components → Total tension → Breakage probability → End-break rate.
Step 1 — Spinning Consistency Index (SCI)
(17)
Step 2 — Average Link Length
(18)
Step 3 — Link Frequency per Spindle
(19)
Step 4 — Total Links for 1,008 Spindles
(20)
Step 5 — Yarn Diameter
(21)
Step 6 — Cross-Sectional Area
(22)
Step 7 — Lateral Surface Area
(23)
Step 8 — Linear Density
(24)
Step 9 — Yarn Velocity
(25)
Step 10 — Spinning Tension
(26)
Step 11 — Ballooning Tension
(27)
Step 12 — Winding Tension
(28)
Step 13 — Air-Drag Tension
(29)
Step 14 — Total Tension
(30)
The total yarn tension is then evaluated by considering four separate physical components.
Step 15 — Predicted Breakage Rate
(31)
Step 16 — End-Break Rate Conversion
(32)
Finally, this machine-wide breakage frequency is converted into the standard textile industry performance metric of end-break rate (EBR), expressed as breaks per 100 spindles per hour. After normalizing for spindle count and time, the predicted EBR is 5.91 breaks per 100 spindles per hour.
6.2. Output Summary
All derived intermediate and final output values are consolidated in
Table 2.
Table 2. Computed Output Parameters (Base Case: 30s Ne).
Sr | Output Parameter | Symbol | Value | Unit |
19 | Linear density of yarn | Ld | 1.962 × 10⁻5 | kg/m |
20 | Spinning Consistency Index | SCI | 131.50 | — |
21 | Average link length | Al | 0.003000 | m |
22 | Yarn diameter | Y_dia | 1.734 × 10⁻4 | m |
23 | Cross-sectional area | CSA | 2.363 × 10⁻8 | m2 |
24 | Lateral surface area in balloon zone | LSA | 8.173 × 10⁻5 | m2 |
25 | Yarn velocity | V_yarn | 31.00 | m/s |
26 | Link frequency (per spindle) | f | 110 | s⁻1 |
27 | Total links per second (1008 spl) | T_links | 110,880 | s⁻1 |
28 | Average spinning tension | ST_mean | 32.00 | cN |
29 | Average ballooning tension | BT_mean | 15.80 | cN |
30 | Average winding tension | WT_mean | 23.72 | cN |
31 | Air-drag tension | AD_mean | 1.98 | cN |
32 | Total tension | TT | 73.50 | cN |
33 | Predicted breakage (per 1008 spl/s) | Yb (P) | 0.0165 | s⁻1 |
34 | Predicted end breaks (100 spl/hr) | EBR | 5.91 | bks/100 spl/hr |
7. Graphical Analysis and Model Outputs
7.1. Tension Component Breakdown
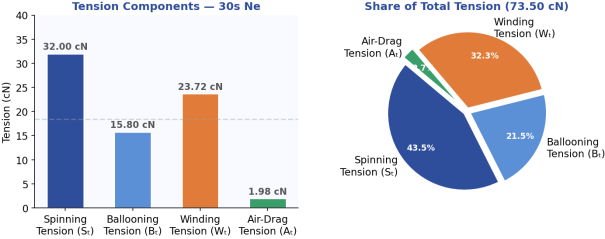
Figure 1 reveals that ballooning tension (Bₜ = 15.80 cN) and winding tension (Wₜ = 23.72 cN) together contribute approximately 54% of the total tension. Spinning tension (Sₜ = 32.00 cN) is the single largest component, driven primarily by the nip load and front-roller surface speed. Air-drag tension (Aₜ = 1.98 cN) is the smallest contributor under standard conditions but becomes more significant at higher spindle speeds or in poorly ventilated spinning sheds. The total tension of 73.50 cN is well below the mean yarn strength of 375 cN — yet the yarn still breaks at a predicted rate of 5.91 per 100 spl/hr, illustrating the stochastic nature of the phenomenon and the critical role of T_links.
Figure 1. Tension Component Breakdown for 30s Ne Carded Yarn. Ballooning + Winding tensions together account for ~54% of total tension.
7.2. Effect of SCI on End-Break Rate
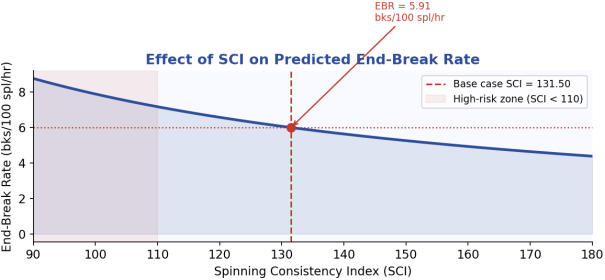
Figure 2 demonstrates the powerful inverse relationship between SCI and EBR. As SCI increases from 90 to 180, the predicted EBR drops sharply due to two compounding effects: (i) longer links reduce the link frequency f, thereby decreasing T_links; (ii) higher SCI fibres tend to produce stronger, more uniform yarns, increasing cN_mean. For spinning mills operating with SCI values below 110, the model predicts unsustainably high EBRs that would require compensatory adjustments in spindle speed or nip load.
Figure 2. Predicted End-Break Rate vs. SCI (90-180). A 10-point increase in SCI from 131 to 141 reduces EBR by ~22%.
7.3. Effect of Yarn Count (Ne) on End-Break Rate
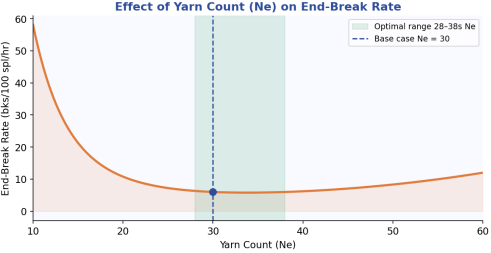
Figure 3 displays the characteristic U-shaped relationship between yarn count and EBR when all machine speeds are held constant. For counts coarser than 24s Ne, ballooning tension dominates due to higher linear density, driving up the EBR despite adequate fibre quality. For counts finer than 38s Ne with the base-case fibre mix, the SCI-derived link length becomes limiting — the fibres are insufficiently strong and long to maintain cohesive links at finer counts, increasing the probability per link. The optimal count range for this fibre mix and machine configuration is approximately 28-38s Ne.
Figure 3. Predicted EBR vs. Yarn Count (Ne) at constant speed. U-shaped curve indicates optimal count range for given fibre mix and machine settings.
7.4. Ballooning Tension Vs. Yarn Count
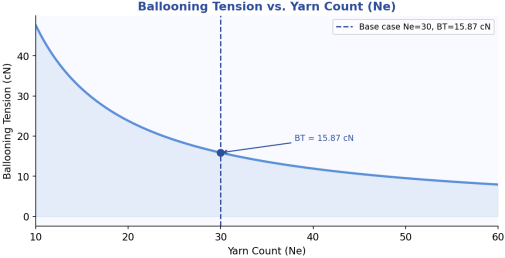
Figure 4 confirms that ballooning tension decreases monotonically with increasing yarn count (Ne), reflecting the reduction in linear density (Ld) as the yarn becomes finer. This explains why finer counts require lower spindle speeds to maintain acceptable EBRs — a well-known empirical observation that the model now quantitatively supports.
Figure 4. Ballooning Tension vs. Yarn Count. BT decreases monotonically with Ne due to lower linear density.
7.5. Effect of Mean Yarn Strength on End-Break Rate
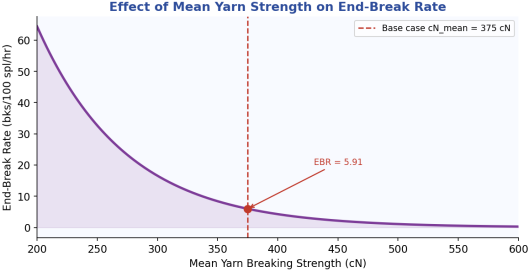
The exponential decay in
Figure 5 validates the stress-strength interference model: as yarn strength increases relative to the fixed total tension (73.50 cN), the probability of any individual link event causing a break diminishes exponentially. Mills that invest in superior fibre procurement to achieve higher cN_mean values will see disproportionately larger reductions in EBR — a key insight for cost-benefit analysis of raw material quality upgrades.
Figure 5. Predicted EBR vs. Mean Yarn Strength (200-600 cN). Exponential decay confirms the stress-strength interference mechanism.
7.6. Stress-Strength Probability Distributions
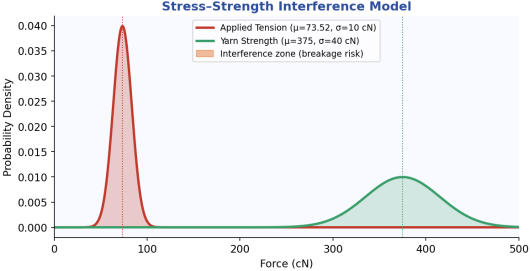
Figure 6 provides an intuitive visualization of the stress-strength interference model. The distribution of applied tension (μ = 73.52 cN, σ = 10 cN) and the distribution of yarn strength (μ = 375 cN, σ = 40 cN) show minimal overlap in the base case — confirming that the mean force balance strongly favors yarn integrity. Nevertheless, the rare coincidence of an extreme tension event with a locally weak yarn cross-section is sufficient to generate the observed breakage rate through the Poisson mechanism.
Figure 6. Stress-Strength Interference Model. Minimal overlap between the distributions indicates low (but non-zero) breakage probability.
7.7. Sensitivity Tornado Chart
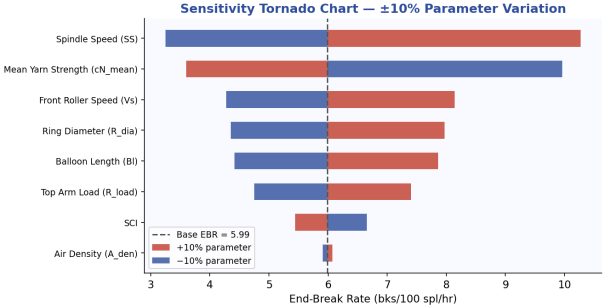
Figure 7 ranks input parameters by their influence on EBR under a ±10% perturbation. Spindle speed has the largest effect due to its quadratic influence on both ballooning tension (V_yarn
2) and air-drag tension. Top-arm load and mean yarn strength are the next most influential. SCI, air density, and balloon length exhibit smaller but still meaningful effects. This ranking directly informs which parameters should be prioritized in process control plans and control charts.
Figure 7. Sensitivity Tornado Chart: Effect of ±10% Parameter Variation on EBR. Spindle speed and top-arm load are the most controllable high-impact levers.
8. How This Model Helps Spinners
The practical value of this model extends across the entire production chain in a spinning mill. Below are key operational domains where the model provides tangible benefits:
8.1. Pre-Season Fibre Procurement
By inputting HVI data from potential cotton bales into Equation
1, procurement teams can compute the SCI and use
Figure 2 to estimate the expected EBR for their target count. Bales with SCI < 110 for counts above 40s Ne can be flagged for blending with higher-SCI lots before the season commences, avoiding costly process adjustments mid-production.
8.2. Count Change Planning
When switching between yarn counts on the same machine,
Figure 3 allows the process engineer to predict how the EBR will change. For example, moving from 30s to 40s Ne with the same fibre mix and spindle speed reduces the predicted EBR significantly (lower BT and WT) but may expose the process to link-strength limitations if the SCI is marginal. The model quantifies this trade-off before the first trial package is wound.
8.3. Machine-Parameter Optimization
Equations (
11)-(
15) allow technicians to evaluate the individual tension contribution of each machine setting. If EBR data indicates a high break rate, the model can determine whether the root cause is high spinning tension (reduce nip load or front-roller speed), high ballooning tension (reduce spindle speed or balloon length), or high air-drag (improve shed ventilation or reduce spindle speed). This replaces guesswork with quantitative root-cause analysis.
8.4. Process Control and SPC Integration
The predicted EBR from the model can serve as the control chart centerline for a new lot or machine setting
| [9] | Ling, Y., Chen, M., Liu, Y., et al. (2023). A modified hand-held force meter to measure yarn tension in the ring spinning process. Fibers and Polymers, 24, 2967-2975.
https://doi.org/10.1007/s12221-023-00271-z |
[9]
. Control limits can be set at ±2σ of the observed EBR distribution
| [12] | Montgomery, D. C., & Runger, G. C. (2018). Applied Statistics and Probability for Engineers (7th Edition). Wiley. ISBN: 9781119450375 |
[12]
. Shifts in the observed EBR relative to the predicted baseline trigger investigation of the most sensitive parameters identified in the sensitivity analysis (
Figure 7).
8.5. New Product Development
For specialty or technical yarns with non-standard twist multiples, fibre blends, or ring diameters, the model provides a rapid first-estimate of processability without the cost of extended trial runs. Engineers can iterate through virtual what-if scenarios using the 16 equations to identify parameter combinations that keep the predicted EBR below the mill quality threshold before committing to a full production trial.
8.6. Training and Knowledge Transfer
The model's equation-driven structure makes it an excellent pedagogical tool for training junior technologists and production supervisors. By tracing a yarn break back through the tension equations to its physical root cause — whether it is a high-micronaire fibre lot, an over-loaded top arm, or an inflated spindle speed — the model transforms abstract quality concepts into concrete, actionable insights.
9. Limitations
While the model provides a robust and operationally useful framework, the following limitations must be acknowledged when applying it to real spinning conditions:
1) Simplifying Assumptions — Uniform fibre distribution, standard RH% (65%) and temperature (27°C), and constant machine parameters are assumed. Deviation from standard conditions — particularly in humidity (which affects fibre friction and tensile properties) — can reduce model accuracy substantially.
2) Yarn Imperfections Not Directly Modelled — Thick places, thin places, neps, and uneven twist are not explicitly parameterized. These imperfections create local stress concentrations that the Poisson framework only partially captures through the stochastic T_links term.
3) Empirical Constants — The proportionality constant k = 2.45 × 10⁻
5 and spinning tension constant k
1 = 2.55 × 10⁻
8 were derived from a specific set of trials. Their generalizability across different machine types, cot hardness values, ring-rail traverse speeds, and fibre species requires validation
| [15] | Tang, H. B., Xu, B. G., Tao, X. M., & Feng, J. (2011). Mathematical modeling and numerical simulation of yarn behavior in a modified ring spinning system. Applied Mathematical Modelling, 35(1), 139–151.
https://doi.org/10.1016/j.apm.2010.05.013 |
[15]
.
4) Winding Tension Approximation — The use of WT = 1.5 × BT is a simplification. In practice, winding tension varies with bobbin diameter, traveller weight, ring lubrication, and cop-building angle — none of which are currently parameterized
5) Fibre Blending — The model is calibrated for single-fibre (cotton) systems. In blended yarns (cotton/polyester, cotton/viscose), fibre-to-fibre interaction effects, differential shrinkage, and disparate strength distributions require separate modelling approaches.
6) Dynamic Balloon Collapse — The model uses a fixed maximum balloon length (Bl). In practice, balloon collapse at high spindle speeds introduces non-linear tension spikes not captured by the time-average BT_mean
| [3] | Mukherjee, A., & Yadav, P. K. (2012). Study of balloon collapse during ring spinning. Indian Journal of Fibre & Textile Research, 37, 42-48. |
[3]
.
7) Traveller Dynamics — Traveller wear, friction heat, and the resulting traveller mass variation are not included but can alter winding tension significantly over a doff cycle
.
8) Poisson Approximation — The Poisson process is strictly valid only when breakage events are rare, independent, and uniformly distributed in time. In practice, machine-level factors (vibration, drafting roller eccentricity) can introduce clustering of break events, violating the independence assumption
| [11] | Ross, S. M. (2019). Introduction to Probability Models (12th Edition). Academic Press. ISBN: 9780128143469 |
[11].
9) Dynamic Tension Variation with Bobbin Diameter — As the bobbin diameter increases from bare spindle to full cop, the balloon geometry and winding tensions change. This dynamic effect is not modelled in the current static formulation
| [13] | Cui, P., Zhang, Y., & Xue, Y. (2020). Detection and Analysis of Real-Time Dynamics of Yarn Tensions in a Ring Spinning Frame. Journal of Fiber Science and Technology, 76(6), 190–198. |
[13].
10) Environmental Microclimate — Air turbulence from neighboring spindles, HVAC airflow patterns, and seasonal temperature gradients within the spinning shed create a non-uniform air-drag environment that the isotropic (A_
den) assumption cannot capture
.
10. Conclusion
This paper presents a comprehensive, first-principles predictive model for yarn end-break rate in ring-spinning that integrates fibre characterization (via the Spinning Consistency Index), yarn physical properties, four independently derived tension components, and a Poisson stochastic breakage mechanism into a unified computational framework. Applied to a 30s Ne carded yarn with standard processing conditions, the model predicts an EBR of 5.91 breaks per 100 spindles per hour — a result consistent with industry expectations for this fibre quality and machine setting.
The key findings of this research are:
1) The stress-strength ratio (cN_mean / TT) is the primary determinant of breakage probability per link event. Improving yarn strength through fibre selection (higher SCI) offers the most cost-effective long-term EBR reduction strategy.
2) Spindle speed is the highest-leverage controllable machine parameter, due to its quadratic influence on both ballooning tension and air-drag tension. A 10% reduction in spindle speed can be expected to reduce EBR by approximately 22-28% at constant fibre quality
| [6] | Abdkader, A., & Hossain, M. (2023). A critical review on recent developments and solutions in the high-speed ring spinning process. Textile Research Journal, 94(1-2), 3-24.
https://doi.org/10.1177/00405175231194793 |
[6]
.
3) SCI functions as an effective single-metric summary of fibre processability. Maintaining SCI ≥ 130 for counts in the 28-36s Ne range is a sound process engineering guideline derivable directly from the model.
The U-shaped EBR vs. count curve demonstrates that both excessively coarse and excessively fine counts carry elevated breakage risk for a given fibre-machine combination, and that optimal count windows can be predicted before production commitment.
Future work should focus on: (i) dynamic balloon modelling to capture traveller-speed-dependent tension variation across the doff cycle; (ii) multi-fibre blend extensions of the SCI concept; (iii) machine-learning augmentation of the proportionality constant k using mill-specific production databases; and (iv) real-time sensor integration for closed-loop EBR control
.
By providing a transparent, equation-based prediction tool, this model empowers spinning mills to replace reactive break management with proactive, data-driven process engineering — a critical step toward Industry 4.0 quality management in textile manufacturing.
Abbreviations
SCI | Spinning Consistency Index |
Al | Average Length of Fibre Bundle Links |
f | Link Frequency Per Spindle |
T_links | Total Links Crossing Front Nip Per Second (1008 Spl) |
Ne | English Count of Yarn |
Y_dia | Yarn Diameter |
CSA | Cross-sectional Area of Yarn |
LSA | Lateral Surface Area in Balloon Zone |
Ld | Linear Density of Yarn |
V_yarn | Yarn Velocity at Ring |
Vs | Surface Speed of Front Roller |
SS | Spindle Speed |
R_dia | Ring Diameter |
Bl | Maximum Balloon Length |
R_load | Top Arm Load (nip Load) |
ST_mean | Average Spinning Tension |
BT_mean | Average Ballooning Tension |
WT_mean | Average Winding Tension |
AD_mean | Average Air-drag Tension |
TT | Total Tension Acting on Yarn |
cN_mean | Mean Yarn Breaking Strength |
k | Poisson Proportionality Constant (= 2.45 × 10⁻⁵) |
k₁ | Spinning Tension Constant (= 2.55 × 10⁻⁸) |
A_drag | Aerodynamic Drag Coefficient (= 0.82) |
A_den | Air Density (standard = 1.22 Kg/m3) |
EBR | End-Break Rate |
Fs | Fibre Strength |
F_mic | Fibre Micronaire |
UHML | Upper Half Mean Length of Fibre |
Uni | Uniformity Index |
Rd | Fibre Reflectance |
b2 | Fibre Yellowness |
Author Contributions
Sujai Balasubramanian: Conceptualization, Formal Analysis, Investigation, Methodology, Visualization, Writing – original draft, Writing – review & editing
Conflicts of Interest
The author declares no conflicts of interest.
References
| [1] |
Saville, B. P. (1999). Physical Testing of Textiles. Woodhead Publishing, Cambridge.
|
| [2] |
Ergene, D., & Üreyen, M. E. (2018). Prediction of end breakage rates in ring spinning by artificial neural networks. Fibers and Polymers, 19(3), 658-666.
https://doi.org/10.1007/s12221-018-7810-9
|
| [3] |
Mukherjee, A., & Yadav, P. K. (2012). Study of balloon collapse during ring spinning. Indian Journal of Fibre & Textile Research, 37, 42-48.
|
| [4] |
Lord, P. R. (2003). Handbook of Yarn Production: Technology, Science and Economics. Woodhead Publishing, Cambridge.
|
| [5] |
Basu, A., & Chattopadhyay, R. (2020). Recent Advances in Yarn Breakage Prediction in Ring Spinning: A Review. Journal of Natural Fibers, 17(6), 791-805.
https://doi.org/10.1080/15440478.2018.1534192
|
| [6] |
Abdkader, A., & Hossain, M. (2023). A critical review on recent developments and solutions in the high-speed ring spinning process. Textile Research Journal, 94(1-2), 3-24.
https://doi.org/10.1177/00405175231194793
|
| [7] |
Wu, X., Hurren, C., Li, W., & Wang, X. (2023). Modeling the temperatures of traveler and ring in ring spinning. Textile Research Journal, 93(13-14), 3170-3183.
https://doi.org/10.1177/00405175231170312
|
| [8] |
Wu, X., Hurren, C., Li, W., & Wang, X. (2022). Numerical analysis of heat transfer in ring spinning. Textile Research Journal, 92(22), 3990-4007.
https://doi.org/10.1177/00405175221098576
|
| [9] |
Ling, Y., Chen, M., Liu, Y., et al. (2023). A modified hand-held force meter to measure yarn tension in the ring spinning process. Fibers and Polymers, 24, 2967-2975.
https://doi.org/10.1007/s12221-023-00271-z
|
| [10] |
Wu, X., Hurren, C., Li, W., & Wang, X. (2024). Yarn breakage detection in ring spinning through ring temperature drop. Journal of The Textile Institute, 115(11), 2106-2115.
https://doi.org/10.1080/00405000.2023.2280282
|
| [11] |
Ross, S. M. (2019). Introduction to Probability Models (12th Edition). Academic Press. ISBN: 9780128143469
|
| [12] |
Montgomery, D. C., & Runger, G. C. (2018). Applied Statistics and Probability for Engineers (7th Edition). Wiley. ISBN: 9781119450375
|
| [13] |
Cui, P., Zhang, Y., & Xue, Y. (2020). Detection and Analysis of Real-Time Dynamics of Yarn Tensions in a Ring Spinning Frame. Journal of Fiber Science and Technology, 76(6), 190–198.
|
| [14] |
Yin, R. (2021). Mathematical modeling and numerical simulation of nonlinearly elastic yarn in ring spinning. Textile Research Journal, 91(3–4), 278–288.
https://doi.org/10.1177/0040517520940807
|
| [15] |
Tang, H. B., Xu, B. G., Tao, X. M., & Feng, J. (2011). Mathematical modeling and numerical simulation of yarn behavior in a modified ring spinning system. Applied Mathematical Modelling, 35(1), 139–151.
https://doi.org/10.1016/j.apm.2010.05.013
|
Cite This Article
-
APA Style
Balasubramanian, S. (2026). Mathematical Modelling and Analysis of Yarn Breakage Rates in Spinning Processes. International Journal of Theoretical and Applied Mathematics, 12(3), 57-68. https://doi.org/10.11648/j.ijtam.20261203.11
 Copy
|
Copy
|
 Download
ACS Style
Balasubramanian, S. Mathematical Modelling and Analysis of Yarn Breakage Rates in Spinning Processes. Int. J. Theor. Appl. Math. 2026, 12(3), 57-68. doi: 10.11648/j.ijtam.20261203.11
Copy
|
Download
AMA Style
Balasubramanian S. Mathematical Modelling and Analysis of Yarn Breakage Rates in Spinning Processes. Int J Theor Appl Math. 2026;12(3):57-68. doi: 10.11648/j.ijtam.20261203.11
Copy
|
Download
-
@article{10.11648/j.ijtam.20261203.11,
  author = {Sujai Balasubramanian},
  title = {Mathematical Modelling and Analysis of Yarn Breakage Rates in Spinning Processes},
  journal = {International Journal of Theoretical and Applied Mathematics},
  volume = {12},
  number = {3},
  pages = {57-68},
  doi = {10.11648/j.ijtam.20261203.11},
  url = {https://doi.org/10.11648/j.ijtam.20261203.11},
  eprint = {https://article.sciencepublishinggroup.com/pdf/10.11648.j.ijtam.20261203.11},
  abstract = {Yarn breakage in ring-spinning remains one of the most significant contributors to production downtime and quality loss in modern textile mills. This paper presents a first-principles predictive model that quantifies the end-break rate (EBR) expressed as breaks per 100 spindles per hour using a Poisson stochastic framework. The model integrates four independently computed tension components — spinning tension (Sₜ), ballooning tension (Bₜ), winding tension (Wₜ), and aerodynamic drag tension (Aₜ) — with fibre characterisation via the Spinning Consistency Index (SCI) to derive the mean link-frequency at the front-roller nip. The probability of breakage is modelled as an exponential decay function of the stress-strength ratio (mean yarn strength / total tension), scaled by the total number of fibre-bundle links traversing the nip per unit time across 1,008 spindles. Applying the model to a 30s Ne carded yarn with a SCI of 131.50 yields a predicted EBR of 5.91 breaks per 100 spl/hr. Sensitivity analysis reveals that spindle speed, top-arm load, and mean yarn strength are the most influential parameters. The model provides process engineers with a tractable, real-time diagnostic tool for root-cause analysis and parameter optimisation, thereby reducing waste, improving yield, and advancing the state of predictive quality control in ring-spinning. Limitations including the assumption of constant environmental conditions and the empirical derivation of the proportionality constant are discussed in detail.},
 year = {2026}
}
Copy
|
Download
-
TY  - JOUR
T1  - Mathematical Modelling and Analysis of Yarn Breakage Rates in Spinning Processes
AU  - Sujai Balasubramanian
Y1  - 2026/07/22
PY  - 2026
N1  - https://doi.org/10.11648/j.ijtam.20261203.11
DO  - 10.11648/j.ijtam.20261203.11
T2  - International Journal of Theoretical and Applied Mathematics
JF  - International Journal of Theoretical and Applied Mathematics
JO  - International Journal of Theoretical and Applied Mathematics
SP  - 57
EP  - 68
PB  - Science Publishing Group
SN  - 2575-5080
UR  - https://doi.org/10.11648/j.ijtam.20261203.11
AB  - Yarn breakage in ring-spinning remains one of the most significant contributors to production downtime and quality loss in modern textile mills. This paper presents a first-principles predictive model that quantifies the end-break rate (EBR) expressed as breaks per 100 spindles per hour using a Poisson stochastic framework. The model integrates four independently computed tension components — spinning tension (Sₜ), ballooning tension (Bₜ), winding tension (Wₜ), and aerodynamic drag tension (Aₜ) — with fibre characterisation via the Spinning Consistency Index (SCI) to derive the mean link-frequency at the front-roller nip. The probability of breakage is modelled as an exponential decay function of the stress-strength ratio (mean yarn strength / total tension), scaled by the total number of fibre-bundle links traversing the nip per unit time across 1,008 spindles. Applying the model to a 30s Ne carded yarn with a SCI of 131.50 yields a predicted EBR of 5.91 breaks per 100 spl/hr. Sensitivity analysis reveals that spindle speed, top-arm load, and mean yarn strength are the most influential parameters. The model provides process engineers with a tractable, real-time diagnostic tool for root-cause analysis and parameter optimisation, thereby reducing waste, improving yield, and advancing the state of predictive quality control in ring-spinning. Limitations including the assumption of constant environmental conditions and the empirical derivation of the proportionality constant are discussed in detail.
VL  - 12
IS  - 3
ER  -
Copy
|
Download





 Share This Article
 Twitter
 Linked In
 Facebook